CSM:Usage
From its-wiki.no
Cyclists
In this example section we concentrate on the cyclist scenario. The Cyclist scenario is described in detail, as most of the aspects are similar also to the other scenarios,
- Application Scenario (from D4.5)
- Benefits
- Lessons learned
Picture from Nuria on "air quality" in different roads
Picture from Eivind (he is cycling)
Track usage in mobile app
Kindergarten
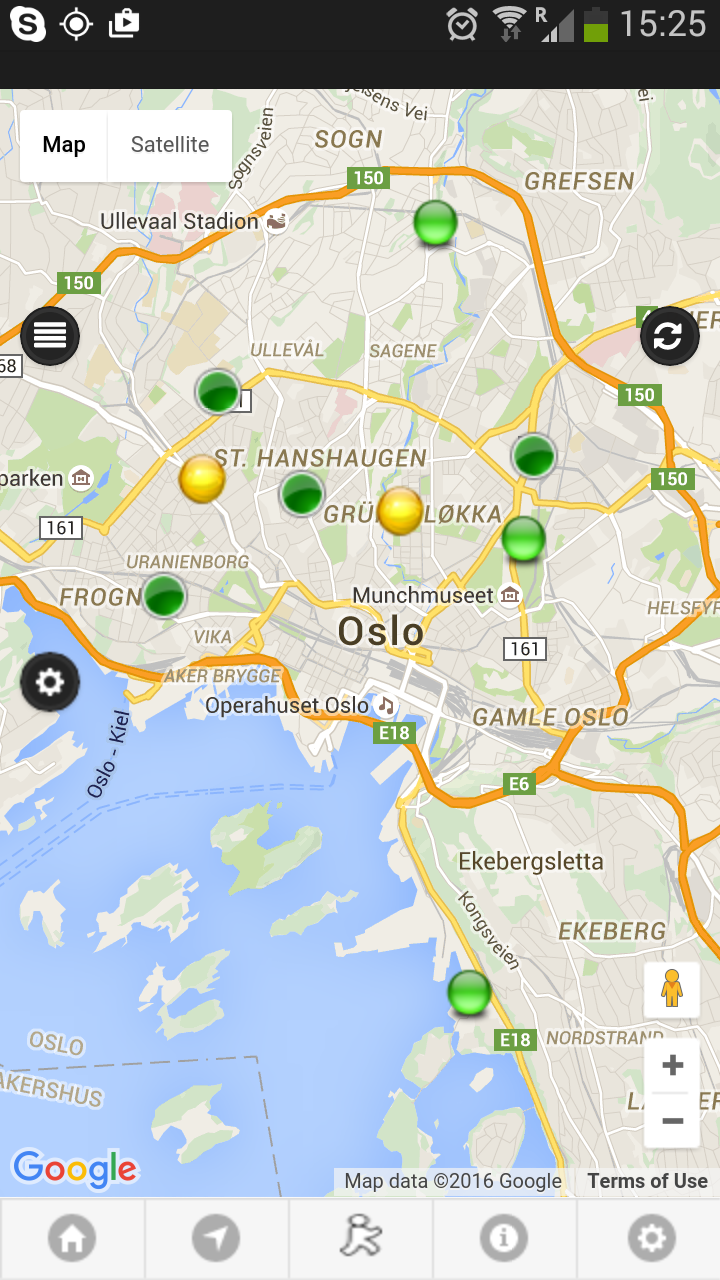
In collaboration with CITI-SENSE 24 sensor units were tested and deployed in fixed locations in Oslo. The sensors distributed in 17 kindergartens and 7 locations in the city using for instance light poles. The sensor platform has been manufactured by GEOTECH (www.geotech.uk) and measures NO, NO2, O3, CO, Noise, Total Particle Count, Temperature, Relative Humidity and Atmospheric Pressure. The data is provided as hourly averages. The sensor platform has a lithium battery with capacity for approximately 6 months. The independence of power supply facilitates their location in areas where power supply it is not accessible.
The data is accessible from the web portal of the manufacturer, but NILU (one of Citi-Sense-Mob partners) has developed in the framework of the Citi-Sense-MOB project and algorithm to transmit the data from the GEOTECH services to the WFS Server. That will ensure all the data from the different sensors in located in the same WFS server (main server). From the WFS server sensors measurements are accessible and visualized by the "Sense City Air" app.
Regular citizens
Trafic wardens
Bus
Two air quality sensors were mounted to two buses in Oslo. The sensor platform employed in the buses has been designed and developed by IA-ADN. The platform pumps air from outside the bus to a chamber in contact with the sensors through an 6 mm diameter tube located on the top of the bus. The chamber is located inside the bus. The air quality platform is connected with a computer system that collects data directly from the bus, such as, speed, position, use of breaking, etc. Using the General Packet Radio Service (GPRS), the air quality and driving pattern data, together with the position (GPS) information, are transmitted to a central database for storing, retrieving, aggregating, manipulating and presenting of the sensor data.
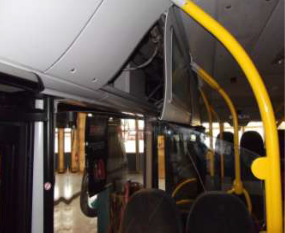
The sensor platform is monitoring NO2, CO, temperature and relative humidity. The system communicates data every 30 seconds. The sensor has been mounted in a diesel bus and in a Compressed Natural Gas (CNG). Below pictures show the location of the sensors in the bus CNG bus and diesel bus.
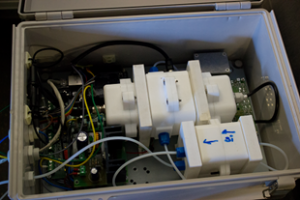
The air quality sensor is mounted on the overhead lockers as it shown below, and it is connected with the CatedBox responsible of gathering the speed, time stamp and position of the bus among other variables related with the driving patterns. The screenshots for Bus Sensor Package on the right, shows the sensor platform electronics. The electrochemical sensors for NO2 and CO are located inside an air chamber where the air is pumped from outside. The chamber has an ozone filter to improve the performance of the sensor by reducing the cross-interferences between ozone and NO2. It has also a humidity controller to prevent the sensors to be exposed to extreme humidity that could damage them.


